


The Property Council of Australia’s (PCA) latest Office Market Report outlines that the early stages of the COVID-19 pandemic has so far only had a modest effect on office vacancy rates, which it says reflects the strong base settings for most CBD markets at the outset of the pandemic.
According to the report, Australian CBD and non-CBD office vacancy increased from 8.3 per cent to 9.5 per cent over the six months to July 2020 with flat tenant demand overall.
Despite the COVID-19 pandemic, aggregate Australian vacancy remains below its historic average, with the key Sydney and Melbourne CBDs sitting at less than 6 per cent vacancy.
Office vacancies are calculated on whether a lease is in place for office space, not whether the tenant’s employees are occupying the space or working from home.
PCA Chief Executive Ken Morrison detailed that the record low rates of vacancy in Australia’s biggest CBD office markets of Melbourne and Sydney had provided a strong buffer against the initial impact of COVID-19.
“The impact of COVID-19 on our CBDs and office markets is still at an early phase, but so far the pandemic has had only a modest impact on vacancy rates,” he said.
“Office markets started this pandemic in good shape, with incredibly low vacancies in Sydney and Melbourne, and strengthening positions in most other markets.”
“Vacancy rates have increased over the past six months, but tenant demand has so far been flat, not falling, and overall vacancies are still below the historic average,” Mr Morrison shared.
“It’s a reminder that office markets have been resilient in the first stage of the pandemic, despite the fact that many office workers have spent months working from home.”
While there is plenty of talk about the end of the office, Mr Morrison said the data doesn’t suggest this and notes that there is a long way to go as business works its way through the economic and social impacts of COVID-19.
“While office vacancies increased over the period, aggregate tenant demand was flat across CBD markets with vacancy increases driven by increases in supply. However tenant demand did vary from market to market, most notably in Sydney where net demand fell 1.2 per cent,” he said.
“Sublease vacancy in the capital cities – a key metric in falling markets – increased by 0.2 per cent, but this is still at modest levels compared to previous downturns.”
“The reactivation of our CBDs and office buildings will be an important element of our economic recovery in coming months, and something that all levels of government will need to consider carefully,” Mr Morrison added.
The vacancy rate for the Sydney CBD was 5.6 per cent (up from 3.9 per cent in January) and the Melbourne CBD vacancy was 5.8 per cent (up from 3.2 per cent in January).
Melbourne CBD vacancy was most significantly impacted by a 4.6 per cent increase in additional office supply, while the Sydney CBD vacancy was most influenced by 1.2 per cent reduction in tenant demand.
Vacancies in other capital city markets are sitting at Canberra at 10.1 per cent, Brisbane at 12.9 per cent, Adelaide at 14.2 per cent and Perth at 18.4 per cent.
All capital city markets recorded lower vacancy in prime over secondary stock.
While almost 400,000 square metres (sqm) of new office space prepares to come onto capital cities markets in the remainder of this year, the Melbourne CBD will account for 48 per cent of this space of which 82 per cent is already pre-committed.
According to the PCA, almost 1.2 million sqm of office space will be supplied in CBD markets over the next two and a half years.
Below are some highlights from the report:
- Australian office market vacancy increased from 8.3 per cent to 9.5 per cent.
- Net absorption was -60,227 sqm over the six months to July 2020. The historic average is 155,035 sqm.
- 353,255 sqm of space was added over the six months to July 2020 – above the historical average of 311,113 sqm.
- A total of 83,910 sqm was withdrawn over the period, just over half the historical average of 163,464 sqm.
- By net absorption, the best-performing markets were Melbourne CBD, Canberra and Macquarie Park.
CBD markets
- Vacancy for the total Australian CBD office market increased from 8 per cent to 9.2 per cent.
- Sydney CBD and Melbourne CBD total vacancy are 5.6 per cent and 5.8 per cent, respectively. All other CBD markets tracked have double-digit vacancy figures: Canberra 10.1 per cent; Brisbane 12.9 per cent; Adelaide 14.2 per cent; Perth 18.4 per cent.
- Net absorption for the Australian CBD office market was 691 sqm. The historic average is 97,88 5sqm.
- A total of 300,864 sqm of stock was added to CBD markets over the period. The historical average is 236,245 sqm.
- 60,081 sqm was withdrawn. The historic average is 126,678 sqm.
Non-CBD markets
- Vacancy for the total Australian Non-CBD market increased from 9.2 per cent to 10.3 per cent.
- Net absorption was -60,918 sqm. The historical average is 57,151 sqm.
- 52,391 sqm of stock was added to Non-CBD markets over the period. The historic average is 74,868 sqm.
- 23,829 sqm of stock was withdrawn over the period. The historic average is 36,785 sqm.
- By vacancy, the top 3 non-CBD markets are East Melbourne (2.2 per cent), Parramatta (4.5 per cent) and Macquarie Park (6.8 per cent).
Future supply – total
- A total of 631,062 sqm of stock is expected to be added in the second half of 2020, more than twice the 6-month historic average of 311,113 sqm.
- The historical average 12-month supply of space to the total Australian market is 622,226 sqm.
- In 2021 a further 471,006 sqm is due to come online around the nation.
- 853,400 sqm is due to come online from 2021 onwards.
- A total of 888,828 sqm is mooted.
Future supply – CBD markets
- A total of 390,500 sqm of stock is due to be added to CBD markets in the second half of 2020 – above the 6-month historic average is 236,245 sqm.
- The historical average 12-month supply of space to the total CBD markets is 472,490 sqm.
- In 2021, 350,086 sqm is due to be added.
- A further 679,315 sqm is due to come online from 2022 onwards.
- A total of 436,054 sqm is mooted.
Future supply – Non-CBD markets
- A total of 240,562 sqm of stock is due to be added to Non-CBD markets in the second half of 2020, which is more three times the 6-month historic average of 74,868 sqm.
- The historical average 12-month supply of space to the total Non-CBD markets is 149,736 sqm.
- 120,920 sqm is due to be added in 2021.
- 174,085 sqm of space is due to come online from 2022 onwards.
- A total of 452,774 sqm is mooted.
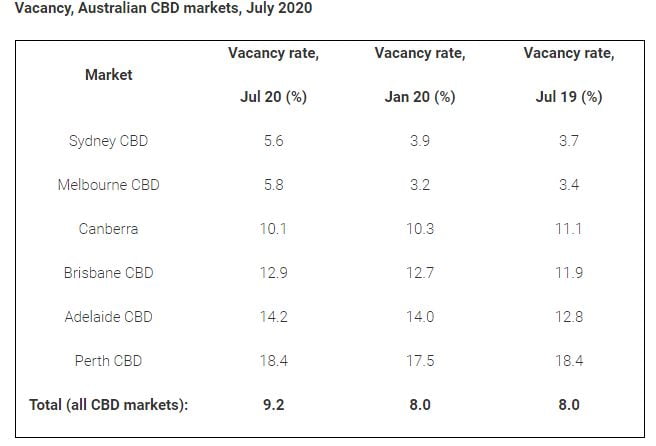
Image credit: The Property Council of Australia.
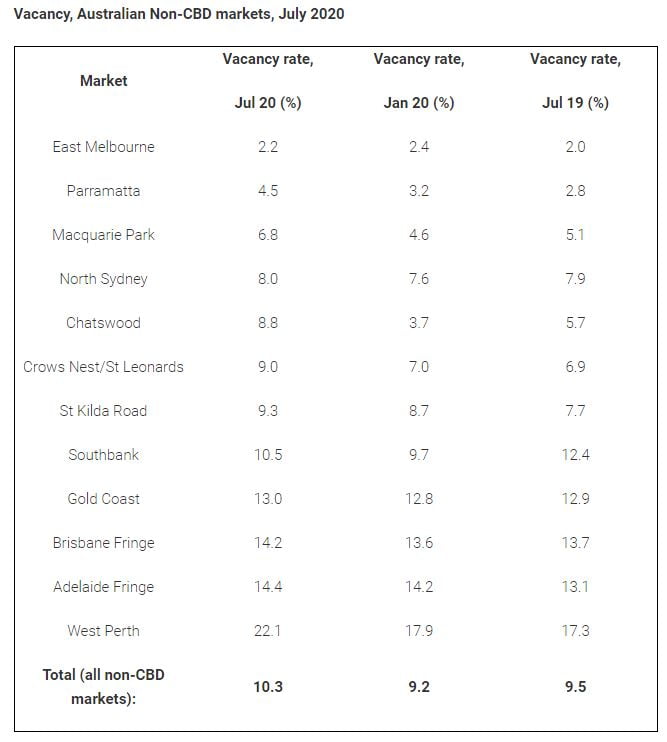
Image credit: The Property Council of Australia.