


Australian office vacancies have edged higher as the COVID-19 pandemic has reduced demand for office space at the same time that significant new supply has entered the market over the six months to January 2021.
The Property Council of Australia’s Office Market Report for the six-month period to January 2021 outlines that Australia’s office market vacancy rate increased from 9.6 per cent to 11.7 per cent – its highest level since January 1997.
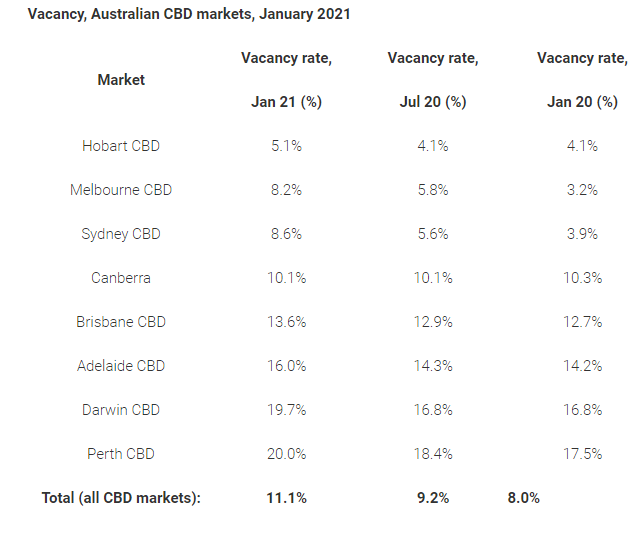
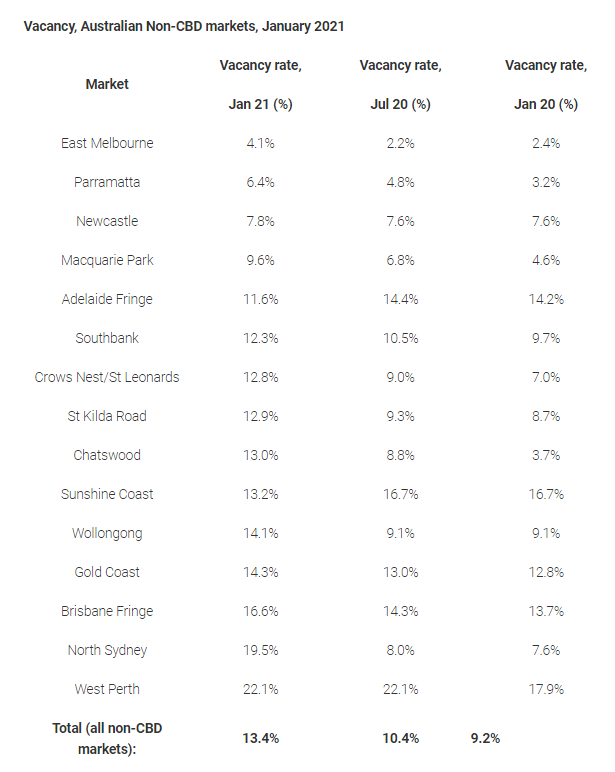
CBD vacancy increased from 9.2 per cent to 11.1 per cent, the highest level since January 2015. Non-CBD markets recorded a larger increase in vacancy, from 10.4 per cent to 13.4 per cent, the highest level since 1995.
Chief Executive of the Property Council of Australia, Ken Morrison, said while COVID-19 has reduced demand for office space, most of the increase in vacancy is related to new office buildings coming into the market.
“While it was not a surprise to see office vacancies increase in the middle of a pandemic, it is the new supply of office space that is responsible for three-quarters of this impact, not reduced tenant demand,” Mr Morrison said.
“COVID-19 has reduced demand for office space as businesses downsize, but this had a much smaller influence on vacancy rates than the new supply coming on stream.”
“Our biggest CBD office markets of Sydney and Melbourne were in very strong shape prior to the onset of the economic downturn caused by the pandemic,” he shared.
“While vacancy rates for the six months to January 2021 are now the highest in some years, there is still strong interest in commercial property as evidenced in recent deals, particularly for premium CBD stock.”
Despite talk of a flight from the CBD in response to COVID-19, Mr Morrison noted that non-CBD markets also saw notable increases in vacancy indicating that widespread health restrictions across all workplaces and the economic downturn caused by the pandemic were strong prevailing influences, rather than an aversion to CBD offices.
“As our office markets adapt to a COVID-normal setting, business and government have a critical role to play in supporting the return to office workplaces and helping more people come back to office precincts,” he commented.
“Vibrant CBDs drive investment, growth and productivity and must be part of our national recovery planning.”
Office vacancies are calculated on whether a lease is in place for office space, not whether the tenant’s employees are occupying the space or working from home.
Below are some key results – six months to January 2021
- Australian office market vacancy increased from 9.6 per cent to 11.7 per cent – the highest since January 1997.
- Net absorption was -158,26 square metres (sqm) over the six months to January 2021 – the lowest since July 2013. The historic average is 151,447 sqm.
- 544,510 sqm of space was added during the period – the highest since July 2010. 353,255 sqm of space was added over six months to July 2020. The historical average of 311,793 sqm
- A total of 91,020 sqm was withdrawn over the period. The historical average is 162,181 sqm.
- By net absorption, the best-performing markets were Canberra (50,144 sqm), Parramatta (28,673 sqm), and Crows Nest/St Leonards (11,909 sqm).
CBD markets
- Vacancy for the total Australian CBD office market increased from 9.2 per cent to 11.1 per cent – its highest since January 2015.
- Melbourne CBD vacancy was 8.2 per cent, up from 5.8 per cent, and Sydney CBD was 8.6 per cent up from 5.6 per cent.
- All other major CBD markets continued to report double-digit vacancy figures: Canberra 10.1 per cent (unchanged); Brisbane 13.6 per cent (up from 12.9; Adelaide 16 per cent (up from 14.3); Perth 20 per cent (up from 18.4).
- Net absorption for the Australian CBD office market was -89,477 sqm, the lowest since July 2013. The historic average is 96,291 sqm
- A total of 339,833 sqm of stock was added to CBD markets over the period. The historical average is 237,287 sqm
- 63,763 sqm was withdrawn, about half the historic average is 125,604 sqm
Non-CBD markets
- Vacancy for the total Australian non-CBD market increased from 10.4 per cent to 13.4 per cent – the highest since January 1995.
- Net absorption was -68,790 sqm – the lowest on record. The historical average is 55,156 sqm
- 204,677 sqm of stock was added to non-CBD markets over the period – more than two and a half times the average of 74,506 sqm
- 27,257 sqm of stock was withdrawn over the period. The historic average is 36,576 sqm
- By vacancy, the top three non-CBD markets are East Melbourne (4.1 per cent), Parramatta (6.4 per cent), Newcastle (7.8 per cent) and Macquarie Park (9.6 per cent)
Future supply – total
- A total of 652,208 sqm of stock is due to be added in 2021, in line with the 12-month historic average
- The historical average 12-month supply of space to the total Australian market is 622,088 sqm
- A further 619,04 1sqm is due to come online around Australia during 2022.
- 361,981 sqm is due to come online from 2023 onwards
- A total of 914,880 sqm is mooted.
Future supply – CBD markets
- A total of 459,156 sqm of stock is due to be added to CBD markets in 2021, in line with the 12-month historic average
- The historical average 12-month supply of space to the total CBD markets is 472,678 sqm
- In 2022, 512,356 sqm is due to be added
- A further 201,000 sqm is due to come online from 2023 onwards
- A total of 552,982 sqm is mooted
Future supply – non-CBD markets
- A total of 193,052 sqm of stock is due to be added to non-CBD markets in 2021
- The historical average 12-month supply of space to the total non-CBD markets is 149,410 sqm
- 106,685 sqm is due to be added in 2022
- 160,981 sqm of space is due to come online from 2023 onwards
- A total of 361,098 sqm is mooted